
Duncan Baldwin
I’ve recently finished leading several training days for primary and secondary school leaders where we looked at Ofsted’s Inspection Data Summary Report (IDSR) and the DfE’s Analyse School Performance (ASP). I took the opportunity to talk about some key principles when using data, for example why averages can be misleading or unhelpful and how important it is to compare like with like.
When you look through ASP you see many tables with rows like this:
As far as the school is concerned, this is a helpful starting point. They would want to know how well their boys and girls had performed, what their pupils with SEN had achieved and so on, when comparing them to the national data contained in ASP. You can even click that green button to compare the performance of disadvantaged pupils with their disadvantaged peers, which is a more accurate, if troubling, comparison than the DfE default setting.
But is this really comparing like with like?
Intersectionality
The term “intersectionality” was coined by the American civil rights advocate Kimberlé Crenshaw in 1989. She devised a framework which can be used to understand how various forms of inequality (such as race, gender and disability) intersect and how the respective combinations of these factors impact on those people’s lives. You can listen to her incredibly powerful TED talk on this subject here.
When we look at ASP we can, for example, see how disadvantaged pupils have performed or how EAL students have performed, but we cannot see the performance of pupils who have both characteristics. There is no combined comparator listed in ASP. This is important because deeper research shows that, on average, disadvantaged EAL pupils actually perform better than even their non-disadvantaged white British peers. If you only analyse one dimension at a time important differences between schools or between pupils in a single school can remain hidden. There is also the risk that incorrect inferences are drawn by school leaders or inspectors. It might also mean that the interventions we use in school to improve attendance or attainment are misplaced or insufficiently focussed.
How the factors connect
In a recent webinar, David Blow, the Executive Head of SESSET multi-academy trust shared an intersectional analysis of pupils from a typical secondary school. He investigated the connection between SEN, pupil premium and persistent absence and looked at the Progress 8 scores of pupils who had any combination of those characteristics.
The information could be set out in a table, as follows:
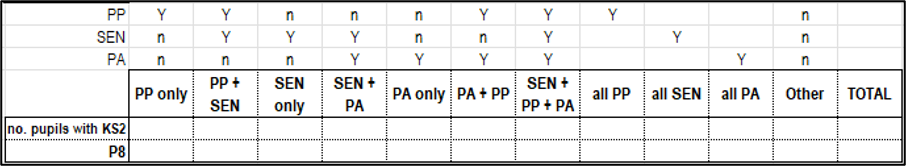
This shows the set of the possible combinations of the three characteristics. But a visual representation using a Venn diagram can highlight the intersectionality issue very clearly. Here is the analysis for an example school:
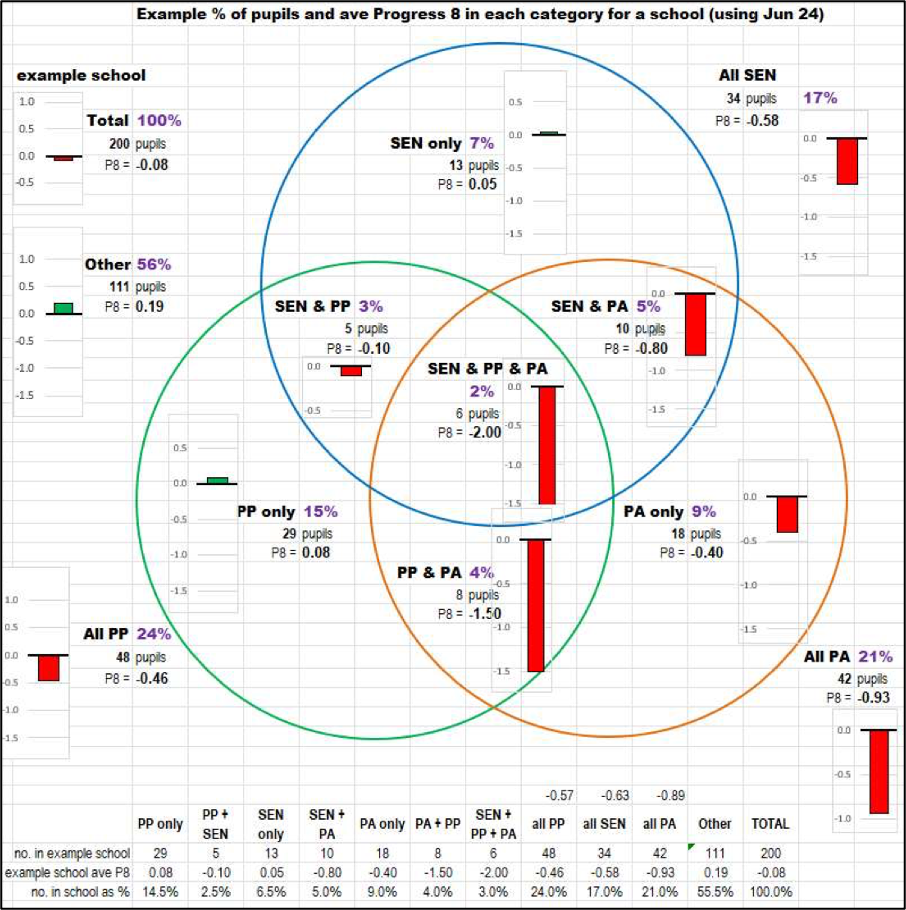
Many of the schools who have worked with David have identified a common pattern, where students who are “PP only” or “SEN only” were not dissimilar to school averages. But when these two factors intersected with each other, and/or with “Persistent Absence” then there were significant differences in Progress 8. When all three factors are taken together, pupils’ progress is even lower.
Professor Crenshaw concludes her TED talk with the words “If we can’t see the problem, we can’t fix the problem”. Intersectional analysis clearly shows the need to unpick strategies for different clusters of pupils; it’s essential to understand the particular issues facing pupils with these combinations of characteristics if we are to find the best ways to help.
Practical takeaways for school leaders
Intersectionality helps leaders see attendance patterns that single categories miss. Persistent absence often concentrates where needs overlap such as SEN combined with disadvantage or emerging anxiety, not within broad groups on their own.
By examining these intersections, schools can focus support where it will have the greatest impact, tailoring follow-up to the specific mix of barriers each pupil faces. It also strengthens collaboration between attendance, pastoral and SEND teams, ensuring the small clusters of pupils with the most complex attendance challenges are clearly identified rather than lost within averages.